Shares of Tesla Inc. (TSLA) have been decidedly rangebound over the last two months, bouncing between support around $220 and resistance at $290. The recent price action, as well as the momentum characteristics, have confirmed this sideways trend for TSLA. How the stock exits this consolidation phase could make all the difference!
Today we’ll look at this intriguing technical setup, show how changes in momentum could confirm a new breakout phase, and describe how we can use a “stoplight” technique to better define risk and reward for this leading growth stock.
It’s Definitely Time to Go Fishing
Jesse Livermore famously said, “There’s a time to go long, time to go short, and time to go fishing.” And were he alive today, I think the chart of Tesla would definitely elicit a “time to go fishing” mindset for Livermore. With the stock bouncing consistently between clear support and clear resistance, this appears to be in a straightforward consolidation phase.
After peaking in December 2024 around $480, TSLA dropped to a March 2025 low around $220. From there, the price has rotated between the 200-day moving average as resistance and that $220 level as support. To be clear, the countertrend rallies in March and April have been impressive, but they have not yet provided enough upside pressure to propel Tesla back above the crucial 200-day moving average.
Momentum Indicators Confirm the Sideways Trend
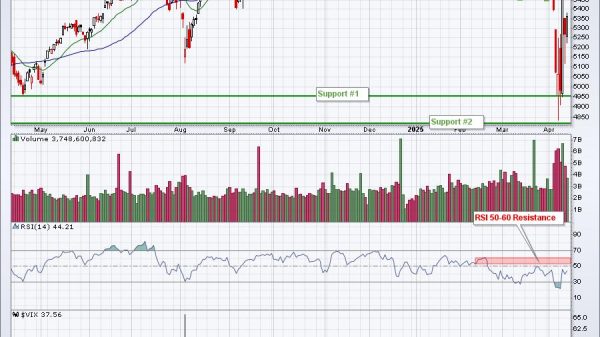
As we love to highlight on our daily market recap show, RSI can be such a valuable tool to assess the interplay between buyers and sellers. During a bullish phase, the RSI usually ranges between 40 to 80, as dip buyers use pullbacks to add to existing positions.
We can see this pattern from June 2024 through the end of January 2025, as the RSI remained above 40 on pullbacks within the bullish trend phase. Then in February 2025, the RSI pushed below 40 as TSLA broke below its 50-day moving average. We’ve color-coded this section red, showing how the entire range of the RSI drifted lower during a clear distribution phase.
Over the last six weeks, the RSI has been in a tight range between 40 and 60. As the price of Tesla has remained rangebound, the momentum readings suggest an equilibrium between buyers and sellers. Until the RSI breaks out of its own sideways range, the chart is suggesting we wait for new information to change the picture.
A Breakout Above $290 Would Suggest a Bullish Resolution
So if we apply a “stoplight technique” to the chart of Tesla, we can better visualize how we might approach this stock from a technical perspective as we negotiate an end to this consolidation pattern.
If we see a positive resolution to the pattern, and TSLA is able to finally clear price resistance and the 200-day moving average around $290, that would indicate a new accumulation phase with further upside potential. A break below $220, on the other hand, would suggest a lack of willing buyers at support and most likely a new distribution phase.
And as long as TSLA remains below $220 and $290, then Jesse Livermore would suggest we “go fishing” instead of taking a shot at an underwhelming chart!
One more thing…
I’ve heard from many investors that struggle with selling too early, leaving potential future gains on the table. Is there anything more painful than that? My recent video may give you some ideas of how to address this in your own investment process.
RR#6,
Dave
PS- Ready to upgrade your investment process? Check out my free behavioral investing course!
David Keller, CMT
President and Chief Strategist
Sierra Alpha Research LLC
Disclaimer: This blog is for educational purposes only and should not be construed as financial advice. The ideas and strategies should never be used without first assessing your own personal and financial situation, or without consulting a financial professional.
The author does not have a position in mentioned securities at the time of publication. Any opinions expressed herein are solely those of the author and do not in any way represent the views or opinions of any other person or entity.